The way to do this is to look at the Total Slack (also referred to as Total Float) for the task. This value shows you the amount of time that a task can move later in time without affecting the finish of the project. Project calculates this automatically for you by performing a forward pass calculation - adding up the durations of tasks going forward to determine how early they can finish, and then a backward pass calculation - the same thing but from the project finish date which was calculated in the forward pass. As a result of these calculations you get an early finish date and a late finish date for every task. The difference between the two is the total slack or float.
The problem with slack is that it is not always visible in the gantt chart. To make it visible is simple. First go to the "Format" menu and select "Barstyles. A dialog box comes up. Add two new barstyles as shown here:
You note that I have two barstyles added and that they both use "finish" and "late finish" except in the opposite order. The reason for this is that Project draws all bars from left to right. The first bar will only be drawn if finish is earlier than late finish. The second bar will only be drawn if late finish is earlier than finish. This is a useful technique to remember for drawing other sorts of bars where you are comparing against another date (such as baseline, deadline etc.)
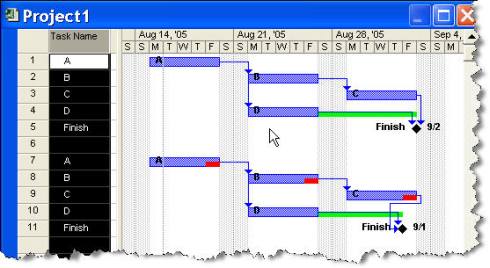
The result of adding these barstyles is shown in the next diagram. You can see for the first group of tasks that Task D has total slack of one week. So if you are in the second week of the project and contemplating whether Task B or Task D is more important to get started on, the answer should be clear that it is Task B.
The Neg Float bar comes into play when your tasks are already too late. In this case I set a "Must Finish On" constraint on the Finish milestone. In effect this makes Tasks A, B & C late by one day. You can see the red bar show up indicating that they are 1 day late. Task D is still showing 4 days of total slack.
By making this information visible on the Gantt chart it is much easier to see what tasks are the ones which will affect your project completion and which tasks are less critical.
Hiç yorum yok:
Yorum Gönder