4 Ocak 2010 Pazartesi
Watch this: Up to speed with Project 2007 - Project - Microsoft Office Online
This video series is designed to help you learn about using Microsoft Office Project 2007 to manage your projects.
Part 1: An overview of basic elements
 | Watch this  In part 1 of this series, I introduce you to the basics of project management, as well as the Project 2007 interface. |
Part 2: Start a new project
 | Watch this  In part 2 of this series, I show you how to start a project by entering a project start date and adding tasks. |
Part 3: Creating relationships between tasks
 | Watch this  In part 3 of this series, I discuss ways to show relationships between the tasks in your project. |
Part 4: Using calendars in your project
 | Watch this  In part 4 of this series, I discuss how Project 2007 uses calendars to identify working and nonworking time. |
Part 5: Build your project's team
 | Watch this  In part 5 of this series, I show you how to add resources to your project. |
Part 6: Identifying project costs
 | Watch this  In part 6 of this series, I discuss how to account for costs in your project. |
Part 7: Check in on your project
 | Watch this  In part 7 of this series, I show you some basic ways to check in on how your project is progressing in Project 2007. |
Part 8: Report on your project
 | Watch this  In the final part of this series, I show you the reporting options in Project 2007, and explain the differences. |
Links and Downloads
Microsoft Project web site:
http://office.microsoft.com/project
Google Search Utility
The "Project Googler" uses the Google API to create a floating Advanced Search Window customized for the Project newsgroups.
Download it HERE. Unzip it to a location on your hard drive. Then you can add a shortcut to it in your Favorites. When you run it you will have a separate window that acts as a search 'launch pad'. Searches started from here will be launched into another browser instance. The buttons at the bottom of the page will automatically set the Newsgroup field for your searches.
Have fun Searching
Project 2007
Microsoft Office Project 2007
http://office.microsoft.com/en-us/project/FX100487771033.aspx
Microsoft Office Project Professional 2007
http://office.microsoft.com/en-us/project/HA101747981033.aspx
Microsoft Office Project Server 2007
http://office.microsoft.com/en-us/projectserver/FX100739841033.aspx
Microsoft Office Project Portfolio Server 2007
http://office.microsoft.com/en-us/portfolioserver/FX101674151033.aspx
Microsoft Office Project Standard 2007 Product Guide
http://office.microsoft.com/en-us/project/HA101680121033.aspx
Microsoft Office Project 2007 frequently asked questions
http://office.microsoft.com/en-us/project/HA101650671033.aspx
Project 2003
Microsoft Windows SharePoint Services Migration Tool
Project 2003 Software Development Kit (SDK)
Project Server 2003 Configuration Planning Guide
Project Server 2003 Installation Guide
Microsoft Office 2003 Web Services Toolkit 2.01
Project Server 2003: Multilingual User Interface (MUI) Packs
Project Server 2003 Administrator's Guide
Project Server 2003 Application Configuration Guide
Project Server 2003 Disaster Recovery Guide
Microsoft Office Project Server 2003: Portfolio Analyzer OLAP Extensions
Microsoft Office Project Server 2003: Project Data Service (PDS) Usage and Methods Reference
Microsoft Office Project 2003 Workgroup Message Handler
Project Server 2003 Database Schema
Microsoft Office Project Server 2003: WinHTTP Proxy Configuration Tool
Project Server 2003 SetTracing Utility
Project Server 2003 Setup Flow Diagram
Project Server 2003 In-Box Documentation
Windows Server 2003 Statement of Support for Microsoft Project Server 2002
Project Server 2003 PSMIGRAT Utility
Microsoft Office Project Server 2003 ConnInfo Utility
Microsoft Office Project Server 2003 PSCOMPlus Tool
Project 2002
Project 2002 Update:
http://office.microsoft.com/downloads/2002/prj1001.aspx
Project Server 2002 Update:
http://office.microsoft.com/downloads/2002/ps1001en.aspx
Project 2002 Software Development Kit (SDK)
http://www.microsoft.com/downloads/details.aspx?FamilyID=2f38311b-5307-4ca4-a7e2-345affc14758&DisplayLang=en
Project 2000
Project 2000 Training Manual 1
Project 2000 Training Manual 2
Project 2000 SR-1 download
Project 98
Project 98 Training Materials- Modules 1-3Project 98 Training Materials- Module 4
Project 98 Training Materials- Modules 5-7
Project 98 Training Materials- Modules 8-9
These are links to one of the BEST sources of information about Project 98 available.
Project 98 Visual Basic Environment Training Materials
1 Ocak 2010 Cuma
Conditional Formatting
IIF statement. If the condition [Text2]="Phase 1"is true, then the first value "Yes"is returned. If false it returns the second value "No". 
Click OK to exit and then it is time to format the barstyle. This is pretty simple. Go to the "Format" menu, Select "Barstyles". Insert a row at the bottom and call it whatever you like. Then set it to draw based on "Flag1" just as shown here:

Set up other barstyles using other flag fields until you have one for every phase or for every category you are interested in. You can see that this file has three custom barstyles. One thing to be wary of. Bars are drawn in the order they are listed in. So a wide bar at the end of the list might be drawn over a bar which is defined earlier in the list. You should define the basic barstyles at the beginning and things like baselines further down the list.
Download the Microsoft Project File (Project 2002 format) that was used for this exampleFormatting Task Links in MS Project
What this means is that if the first barstyle in the list applies to all tasks and is blue, then all the link lines are going to be blue. Since we can layer barstyles we can set the first barstyle to be one color and then overlay it with a different color. The link will take the first color and the task bar will take the color of the later style.
By using the conditional formatting capability of flags we can set this differently for different tasks and thus control the link color on an individual basis.
The first step is to set up some barstyles. In the screenshot you can see that I created white, red and green barstyles BEFORE the default blue barstyle. I use flags to control which tasks these barstyles are used for.

Then we set the flags for the individual tasks. You can see below that the task with Flag1 set to Yes has a white link line with its successors. Likewise with the green and red link lines.

Combining this with a custom field formula to set the value of the flag fields, you can programmatically change the color of the link lines in almost any manner you choose.
MS Project Tip - Working with Float
The way to do this is to look at the Total Slack (also referred to as Total Float) for the task. This value shows you the amount of time that a task can move later in time without affecting the finish of the project. Project calculates this automatically for you by performing a forward pass calculation - adding up the durations of tasks going forward to determine how early they can finish, and then a backward pass calculation - the same thing but from the project finish date which was calculated in the forward pass. As a result of these calculations you get an early finish date and a late finish date for every task. The difference between the two is the total slack or float.
The problem with slack is that it is not always visible in the gantt chart. To make it visible is simple. First go to the "Format" menu and select "Barstyles. A dialog box comes up. Add two new barstyles as shown here:
You note that I have two barstyles added and that they both use "finish" and "late finish" except in the opposite order. The reason for this is that Project draws all bars from left to right. The first bar will only be drawn if finish is earlier than late finish. The second bar will only be drawn if late finish is earlier than finish. This is a useful technique to remember for drawing other sorts of bars where you are comparing against another date (such as baseline, deadline etc.)
The result of adding these barstyles is shown in the next diagram. You can see for the first group of tasks that Task D has total slack of one week. So if you are in the second week of the project and contemplating whether Task B or Task D is more important to get started on, the answer should be clear that it is Task B.
The Neg Float bar comes into play when your tasks are already too late. In this case I set a "Must Finish On" constraint on the Finish milestone. In effect this makes Tasks A, B & C late by one day. You can see the red bar show up indicating that they are 1 day late. Task D is still showing 4 days of total slack.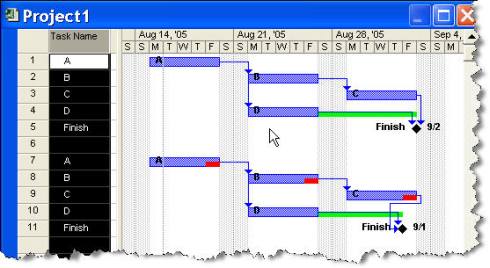
By making this information visible on the Gantt chart it is much easier to see what tasks are the ones which will affect your project completion and which tasks are less critical.
MS Project 2007 - Changing Working Time
For the past few versions of Microsoft Project (Project 2000, Project 2002, Project 2003) the changes to the desktop application have been fairly minor. But Project 2007 shows that some attention is again being paid to the desktop user. One of the more subtle changes that has been made is to add more functionality to the "Change Working Time" feature. This is the way that a user sets and modifies calendars. Go to the tools menu, select "change working time" and the new dialog looks like this:
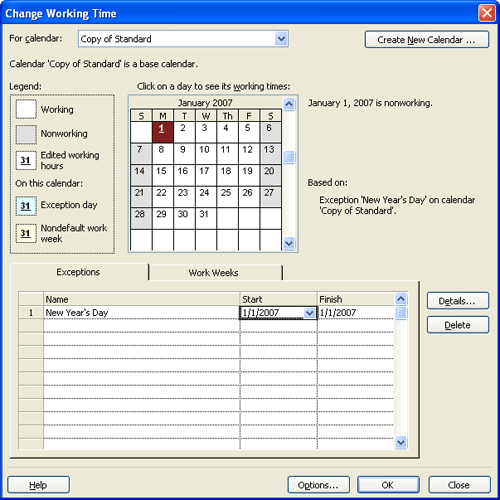
In this example I'm setting the first day of January to be non-working time. What is new about this is that you get to name the exceptions. See the list below? Type in a name for it and you can more easily keep track of it. I am guessing that the name of the exception is retrievable with some code so you could conceivably extract all the exceptions from a project using a bit of VBA and check them against some master list.
The other exciting thing about this is that you can set an exception to recur. Since Jan 1 comes once a year, I'm setting it to be an exception on a yearly basis in the following screenshot:
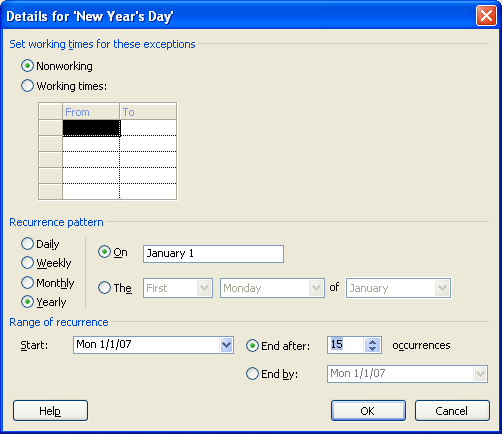
The options are pretty self-explanatory. You can set it to be the same calendar date or if you want it can be the first Monday of a month or the third Tuesday or whatever vacation vagaries your clever company decides to inflict upon you. These options are also available for monthly recurrences. Just knowing that you won't have to scroll through months and months just to set up standard holidays is a great help So is the ability to label the exceptions so you know that 5 days in December of next year are blocked out because the office is being painted rather than having to guess why no work is going on at that time.
I recommend you work through this as you start any new project. Official holidays and vacation time can easily eat up a month of time. If you haven't accounted for this in advance you will find yourself postponiing that vacation or eating Turkey and Pumpkin pie at work.
MS Project 2007 Change Highlighting and the Interim Plan
Microsoft Project 2007 has a new feature called "Change Highlighting". It shows how a change to one task affects others which have dependencies on it. For example, the screenshot below shows how changing Task A from one day to two days affects the start and finish dates for all the other tasks:
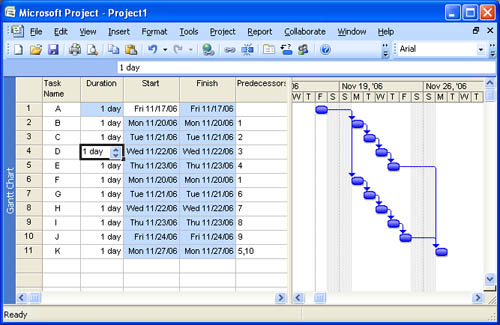
The blue highlighting shows the fields which have changed due to the first change. This is certainly very useful, but it is missing a few things.
- First, we don't know whether the change was a good change or a bad change.
- Second, as soon as we make another change, the highlighting will change to tasks affected by the second change.
- Third, we don't know the magnitude of the change. This is a very simple project and all the changes are one for one, but in some cases a major change to one task may change another by only a very small amount. Perhaps an insignificant amount. But we have no way of knowing from this feature.
Fortunately Project has had the ability to show the effects of changes in a robust and persistant way. That is through the use of an Interim Plan. An interim plan is really a very simple baseline. It stores the start and finish dates of tasks into the user defined start and finish fields (Start1-Start10 and Finish1-Finish10). If you add a couple barstyles to your view you can easily see all changes that were made in an editing session.
The first step is to save an interim plan. To do this go to the Tools menu, select Tracking, then Set Baseline. The following dialog box should appear:

In this example we are using Start1 and Finish1 to store the dates. When you are done click OK. Next we need to set up the barstyles to show three things. Formatting the barstyles is done by going to the Format menu and selecting Format Barstyles
- First we show the interim plan. For this we are using a "silver" colored bar drawn from Start1 to Finish1. It represents the original task.
- Next we create a bar to show if tasks have slipped later than originally planned. We use a red bar for this and set it to draw from Start1 to Start. Project will only draw this bar if the second date is later than the first date.
- Then we create a bar to show if tasks have pulled in. We use a green bar for this and set it to draw from Finish1 to Finish.
When you are done, the barstyle dialog box should show the three bars as below. Note that order is important. The bars are drawn in list order, so if you put the silver bar last it will hide the red and green ones.

When this is set up, go and make some changes in your plan. Here I have made two changes. See if you can figure out what was changed. (hint: originally all durations were 1 day)
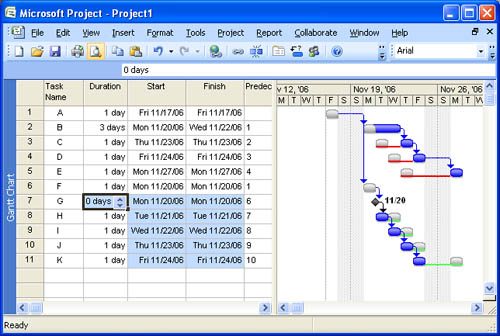 By saving this view and using it whenever you are editing your file you will have a much better indication of what you are doing to your file than you will get from the "Highlight Changes" feature in Project 2007. Not only that, but this technique can be used in Project 98, 2000, 2002 and 2003. I hope you will find it useful. Just remember to reset the interim plan at the start of your editing